Monitor! Stop Being A Blind Data-Scientist.
How monitoring & alerts can help you achieve far better control of your data and how little it is being practiced today.


How monitoring & alerts can help you achieve far better control of your data and how little it is being practiced today.
The following article explains the many use cases and the monumental importance of monitoring & alerts, specifically from a data-science-researcher point-of-view. We’ll look at use-cases and review several companies that try to provide solutions for this huge, but strangely undiscussed problem that overruns our industry.
Modern machine-learning relies on huge amounts of data and we have become quite successful in scraping and saving that data, but we are far from solving one of the biggest pains of data management.
I’m talking about knowing your data, on a daily basis, something that I believe very few scientists practice these days in our industry. In short, data-science-professionals have no idea what is really happening to their data. In terms of annotation, distribution for every segment of your data, for missing and new values, for label distribution, for version history, including package history, etc. We blindly trust our data, this is a common practice that I have seen and experienced it first hand.
Due to circumstances, many startups start by running and proceed to increase speed over time. Understandably, creating models to achieve growth and give value to your clients is important, but in the long run, we are losing sight of something very important. The fact is, that knowing our data is more important than updating your model again and again.
Ask yourself, how do you know that you can trust your data? Without trust, there is no point in updating or creating new models, you could be introducing noise and sabotaging your own work.
On the other hand, creating & maintaining multiple dashboard views for every model that we put in production is cumbersome. Views that observe statistical metrics such as mean Wasserstein-distance, null-hypothesis, F1, Precision and Recall, or product-related metrics. We don’t want to create additional metrics to observe our data and models, we don’t want to create models on top of our metrics that will find anomalies and trends, and we really don’t want to babysit our dashboards on a daily basis.
We want to be given a system that knows to monitor and alert you when things are changing, to do it seamlessly, automatically and get predictive alerts based on machine learning algorithms. Alerts that can detect failure or try to predict future failure ahead of time. When looking at these alerts we want to have some explanation, using model interpretability tools such as SHAP or LIME.
Let's look at some notable use cases.
Use Cases
I have encountered several use cases for data monitoring & alerts, I am sure there are others, but these ones impact you the most as a data scientist. The list is written in chronological order.
Annotators
Annotation Distribution
Data Sources
Data Integrity
Data Distributions
Dependency Versions, i.e., package versions.
Model Versions
Model Parameters
Model Metrics
Business-Product Metrics
Model Software & Hardware Performance (Infrastructure & CI/CD)
Cost Monitoring
Annotators
Annotators are usually the people who label your data, you can read about annotator metrics here. We can also use algorithms to do the annotations for us, whether using some form of a heuristical algorithm, an ensemble, a stacking or using libraries such as Snorkel.
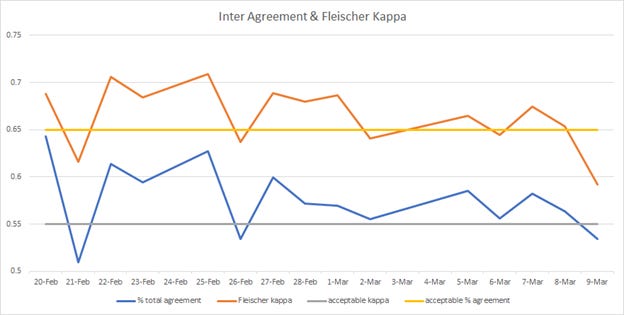
Monitoring metrics such as inter-rater agreement, self-consistency, ground-truth agreement are essential (Figures 1 & 2) because without them you don’t know the quality of your annotation.
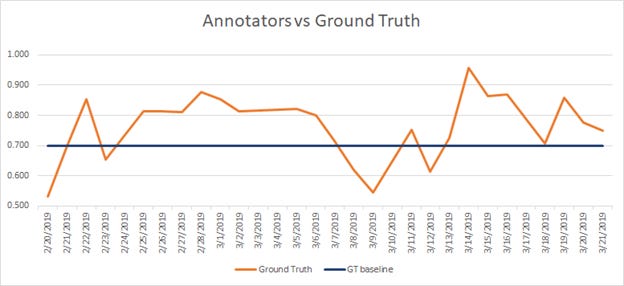
Imagine the following, you have a majority-vote ensemble of annotators that decided on a label, however, several annotators are starting to stray from the initial instructions, for whatever reason. Without you knowing, your annotations end up as label noise or if we are honest we can call them annotation mistakes.
“If you can’t trust your annotators, then don’t use the annotations”
We need to monitor annotator-metrics and get alerts when there is a problem and consequentially throw away data that was labelled badly, i.e., we won’t put it in our final data set.
Without proper monitoring and predictive alerts, you will not catch that label noise in time, therefore wasting a lot of resources such as time and money, you will introduce noise into your training set, directly hurting your models and the client you are trying to give value to.
This can also happen if you don’t monitor annotations that are the result of heuristics or algorithms, for this type of algorithm-based annotation, please read below about data distributions, dependency versions, model versions and model metrics.
Monitoring your source of truth is the most important thing in the data-chain. For example, if you have a supervised problem and your labels are bad, you will struggle to create a good model. It is as and sometimes more important than monitoring your data or training a model.
Annotation Distribution
Now, we believe that we can trust our annotators because we monitored their performance and we discarded annotations that were below our fixed-threshold. Although annotations are not always class labels (e.g., named entities), let’s consider a situation where our annotations are class labels and that we are using them for a supervised problem.
When training a model, the model is trained on a certain distribution of class labels. Monitoring concept-drift for the label-distribution (Figure 3) in production can be done by using 1. Null hypothesis or 2. Average earth mover’s distance (EMD), which is a measure of the mean distance between two probability distributions and is also known as the Wasserstein metric. Depending on the number of classes, the null hypothesis should be used for binary classes or trinary where you have [-1,0,1] and the mean Wasserstein distance should be used when you have multi classes.
“If your real-time label distribution is different than your training data, you have a problem. Take immidate action!”
Typically, you would compare the distribution of the labels of your training set and the distribution of the labels of your production data in real-time. Receiving predictive alerts due to a label-concept-drift can be a life-saver. (Please note that if your retrain strategy is based on active learning, you may find irregularities between the training distribution and live-data, due to the nature of sample selecting from your model’s weakest predicted-distribution).
For example, imagine a case where you trained two similar models, each trained on a unique distribution of labels, but they are closely related and for some reason, a mistake has happened and a single model was deployed to serve all of the data streams instead of having the appropriate model predicting its own stream. Having a label-distribution monitor for each model will tell you that the first model is behaving according to expectation and for the second one, the distribution for the model’s training data is significantly different from the distribution in real-time, which is a critical problem.
Monitoring label distribution can also be used to trigger an event in order to retrain the model. When distributions change naturally or when new clients are added, the label distribution is bound to change. Having that information can help you be more in control when you retrain your model or debug various problems, which can lead to using fewer resources as well.
Data Sources
Your data source is probably the first most important thing in the pipeline. It is imperative to track whether your data source has changed, broke, or disappeared. A monitoring system should keep track, ping for health, and make sure that your data source doesn't vanish overnight, and alert all the relevant stakeholders the moment it happens.
If your data source broke, you dont have data!
Data Integrity
You now know that your annotators and labels are perfect (hopefully). Alternatively, you may be working on an unsupervised problem and you don’t need annotators or annotation-monitoring. It is time to make sure that your data is kept in order. A monitoring system should run and manage your data, by conducting custom & automatic test-driven-data-analysis, using tools such as TDDA and Great Expectations, .i.e., the system should review your data and suggest actions.
“If your data doesn't pass periodic tests, you cant trust it!”
For example, the system should provide an alert following a schema change, which can be caused by natural or artificial processes. Provide an alert when the type of a column may have changed due to new values. Deal with invalid, missing or unique values, etc. These actions should be automatically assigned, given a data-policy, using data governance to the person in charge. The monitoring service should observe data trends and anomalies and inform you when there are issues with data-freshness (daily, weekly), data structure, data-growth, and statistical profiles. This ensures that you know how much of your infrastructure you are utilizing, know how to solve current & unforeseen problems and can calculate future spending.
Data Distributions
You are now confident that your data is in good hands and it has a high level of integrity. Its time to make sure your data distribution is not changing drastically and that your trained model can still serve unseen data.
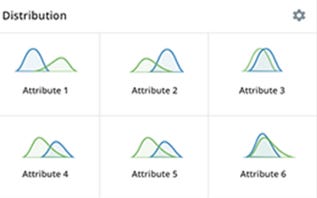
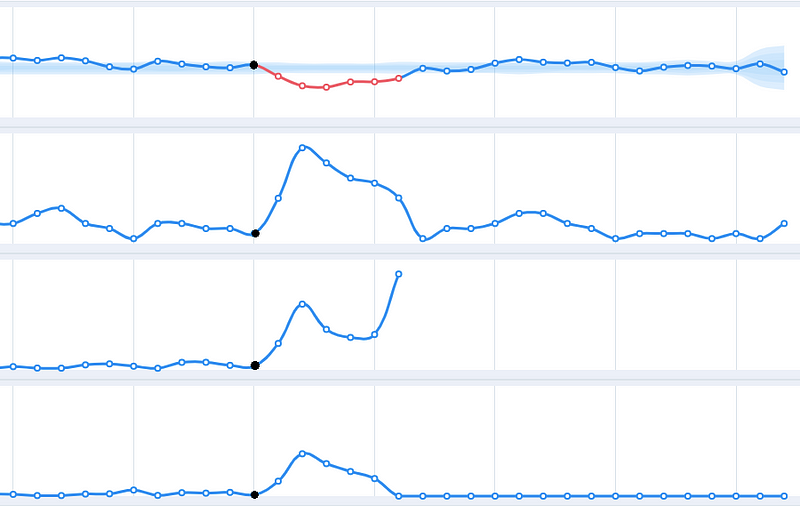
Imagine a case where your data has the following dimensions: Time, Client, Categories and Color. Let’s count how many segments we have, Time is based on a one-minute resolution for the last one year, you have 2000 clients, 30 categories and 3 color classes. Okay, so we have way too many segments that we want to observe. Optimally we would like to use a service that is built to automatically track all of these dimensions without defining them and that service will alert us when a change in distribution is about to happen, in one of those segments (Figure 4). It frees us from building dedicated dashboards using Datadog or Grafana-like services and allows us to focus on research.
“If you can’t trust your data distribution, then don’t use it to train a model”
Similarly to annotation-distribution, for each segment, we need to make sure there isn’t a concept-drift using the same methods and we must investigate the reason for a certain change, or retrain the model in order to support new data-distributions. Keep in mind that we want those alerts to be defined automatically for us, without us fine-tuning each and every one of them and without too many false positives.
Dependency Versions
Most algorithms are based on several dependencies and each one has its own version. Versions change throughout the model’s life and if you don’t keep track of your versions, i.e., the right version dependency for the right algorithm you model will perform differently without you knowing.
Update: I have expanded on this topic in the following post “Monitor your dependencies! stop being a blind data scientist”
For example, imagine an emoji to text package that is being updated on a daily basis, and your NLP algorithm is based on that conversion. A newer version may support new emojis and words may end up mapped to different emojis. This is a critical change that may lead to a model predicting the wrong thing or predicting the right thing with unexpected probabilities.
“If you can’t track your dependencies versions, you can’t trust that your model performance will be deterministic”
In order to preserve a deterministic behaviour, we must record all the dependency-versions for every model that we put in production, as seen in Figure 5. The monitor needs to alert us when a dependency changes. Please note that unit tests will not always catch this behaviour. Dependency version history should be mapped to your prediction, so you can figure out what went wrong when it does go wrong, quickly and easily.
Model Versions
Similarly to dependency versions, knowing that the right model is plugged to the right data is very important. You don’t want to wake up one morning to client complaints and figure out that engineering did not deploy the models correctly.
“If you can’t track your model version, you can’t trust that it was deployed correctly”
This behaviour should be automatically reported when your CI/CD is training and deploying new models, preferably based on the actual version figures, but also on a diff of your deployed artefacts. Version history should be connected and displayed on your model prediction view at all times, so you can figure out what went wrong when it does go wrong, as seen in Figure 5.
Model Parameters
When model versions change, they carry changes in the parameters used for the model. These are not just parameters for the main learning algorithm, these can be various parameters that are changed throughout our “meta-algorithm”.
“If you cant track your meta-model parameters you cant trust that your model will perform as expected”.
Imagine a model version change where a parameter that was tested in the research stage is accidentally carried into production, and that parameter is causing a change in model consistency, compared to previous versions. It will be beneficial to include a way to report back any parameter to our monitoring platform.
Model Metrics
We love to look at model metrics, they tell us how good our model is and we can communicate these numbers externally. However, these numbers rely on upstream events such as labels, data, successful deployment and others.
“If you can’t observe your model performance, you can’t trust it.”
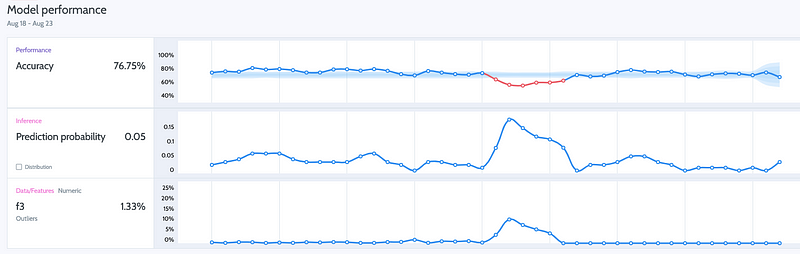
Metrics such as precision, recall, F1 and PRAUC describe our success or failure, therefore we are highly motivated to monitor them in real-time, as seen in Figure 6. For unsupervised algorithms, such as clusters, we can monitor metrics like cluster-homogeneity, etc. Monitoring model performance helps us understand when things start to misbehave or when there are changes upstream.
Business-Product Metrics
Similarly to model performance, there are metrics that were defined as part of the project and are extremely important for Business and Product. These metrics do not have to be the classical metrics that I mentioned above. For example, your model is used as a suggestive model, you are showing your client the top-3 choices based on the top-3 probabilities, similarly to what is happening in Figure 6. Your product-KPI could be accuracy that is based on scoring a prediction in the top-3 probable classes and your alert will be when this number is lower than 95%. Observing these metrics is crucial for a healthy product or feature that you are maintaining and monitoring them is part of your ownership, although I would argue that both business and product need to be able to view them.
“If you can’t observe your product performance, how do you know that your KPI is keeping its goal?”
Theoretically, it’s possible that we are monitoring everything I mentioned so far and everything is perfect. However, these product metrics are still plummeting. It could mean many things but failing to find the reasons that are causing these metrics to drop is a serious problem. Therefore, getting predictive alerts when things are about to go bad is crucial for any product in production.
Model Software & Hardware Performance
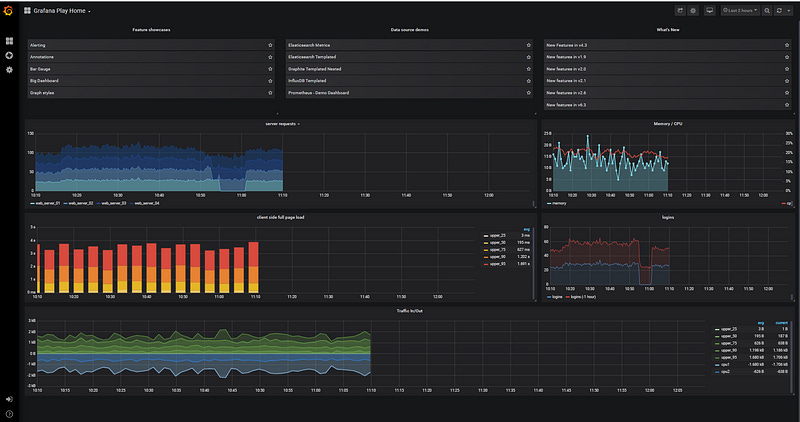
Usually the domain of external non-data-science services, such as New Relic. It’s important to monitor model-processes, such as CPU, GPU, RAM, Network, Storage performance and alerts in order to discover high or load loads, as seen in Figure 7. This will ensure that your model can keep on serving on a healthy system without interrupting production.
Monitoring Features
The following are important features that you should look for when researching companies that offer MLOps or Monitoring solutions:
Black-box integration — simple, one-line callbacks that do not interfere with your research or production code and can be used seamlessly.
Continuous monitoring — dashboards that include indicators for predictive trends or seasonality, and anomaly detection overlayed on top of your monitored signal.
Out of the box metrics & alerts — we want to track immediately by using quick & predefined KPI configuration.
Test-driven data analysis — we want to be automatically informed when there are unforeseen events happening, in the infrastructure level of the data, on a regular basis, using data-tests.
User-driven metrics & alerts— The ability to define custom KPIs & dimensions in the UI. This approach enables monitoring everything, not just “inputs”/”outputs”, and track more complex measures (e,g., the daily average delta between two scores).
Predictive alerts — we want to know ahead of time that something is about to happen.
Noise reduction — Reduce false positive alarms while only alerting when major issues occur, this can be done using rules, heuristics, algorithms or predictive models.
Auto-Benchmarking — Identify and create automatic alerts for each new data-segment, i.e., a dimensional subset of the data. Imagine tracking the client & category features in your dataset, each combination using these features types has its own distribution. Knowing when a certain category is starting to underperform or drift for a certain client is a game-changer, without needing to configure it specifically.
Model interpretability/explainability — similarly to what SHAP & LIME are doing, which allows us to understand why a certain input was predicted in a certain way, while showing which features are contributing to the prediction. Additionally, it should allow us to play with features-values in order to understand their influence on the prediction.
Log auditing — who doesn't like to look at logs? logs can tell us a lot of things about what is happening.
Bias detection — not the machine learning bias we all know, but a bias in terms of a model preferential biased toward a certain population, for example. This kind of bias detection can aid you in being GDPR-compliant and allow you to deal with issues affecting your business negatively.
Cloud or on-premise installation — Usually, most companies offer SaaS services, however, you may need the data to be secure on your own infrastructure due to contract constraints and consequentially on-premise installation.
Services
Luckily several companies already understand that we need tools and solutions. I have already had conversations with three companies, which are trying to develop these much-needed tools. Each one is working very hard to provide various solutions as soon as possible and they are usually headed by experienced data-scientists or people who really understand the field, so that is already a big promise. We really need solutions tailored for our emerging needs. Please note that you should always wrap code that originated in 3rd party companies, especially when dealing with young startups and if you are using open-source solutions you should keep in mind that due to the complexity of this emerging field, client or community-support are highly important.
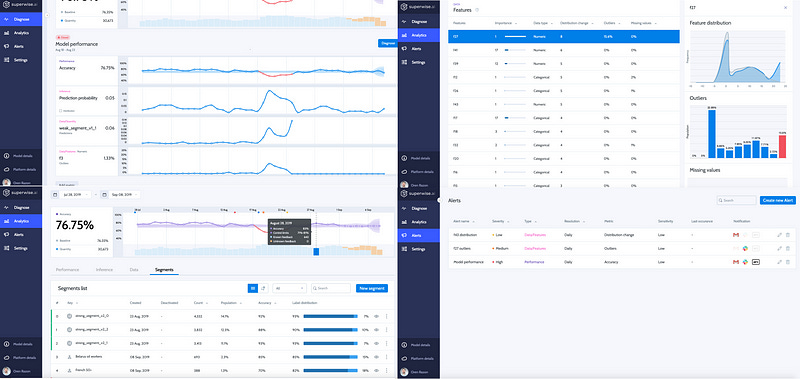
Superwise.ai — An Israeli Startup, By far the most feature-complete solution out there IMO. It includes black-box integration and can connect to any ML solution in production. It has smart & mature features such as real-time performance monitoring & analysis with various predefined KPI’s suited for models and data statistics, predictive intelligence that is based on machine learning models that learn and predict your model’s performance, auto-benchmarking, automatic handling & action-execution, out of the box explanation and bias detection and cloud or on-premise configuration. (Figure 8).
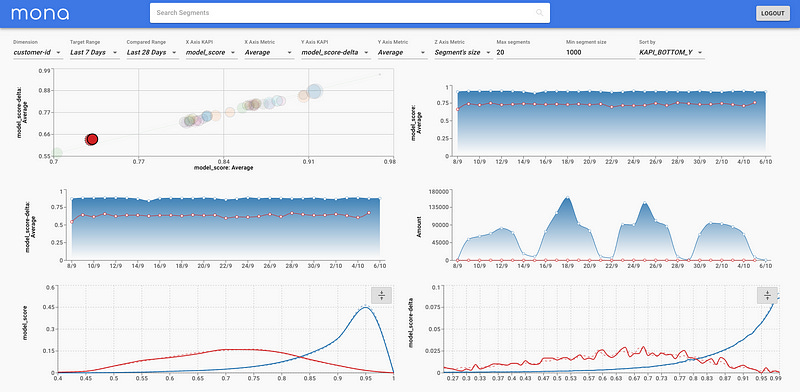
Mona Labs — Another very promising Israeli Startup (not to be confused with the other Mona Labs that created a personal shopper). Mona Labs is led by three ex-googlers. Mona is able to collect and analyze data from models in production, allows us to evaluate model quality in production with out-of-the-box metrics, has user-driven metrics & alerts, auto-benchmarking, is able to detect data-drift or model-bias issues, allows you to create actionable insights, reduces the risk of data integrity and cloud or on-premise configuration (Figure 9).
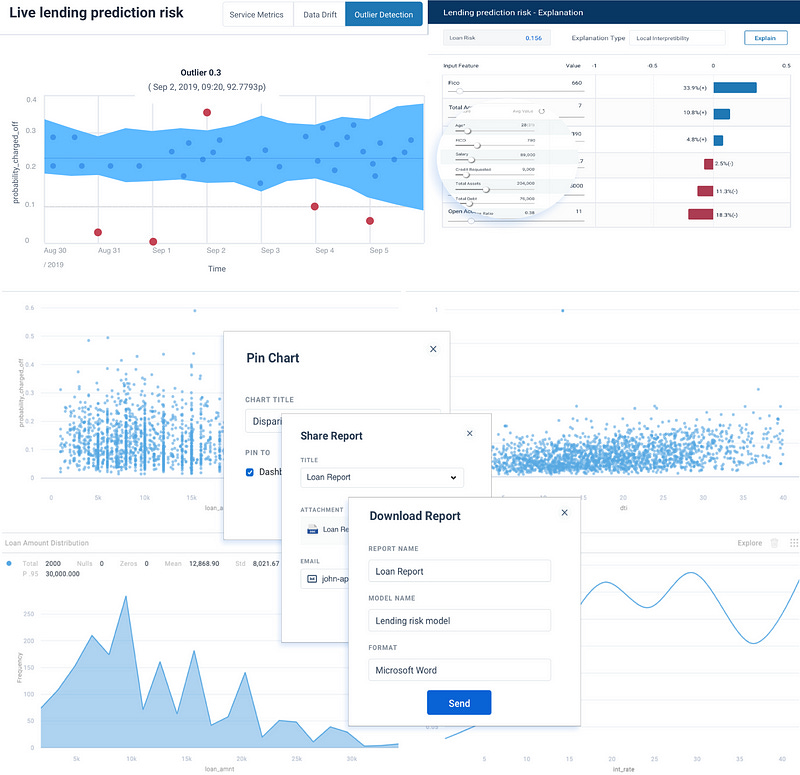
3. Fiddler.ai — A young startup, offers model interpretability with the ability to change features in order to understand their importance, i.e., looking at which features contribute to model predictions. human-in-the-loop auditing, dashboards, reports, attribute comparisons, dimensionality-slicing-performance, feature tracking for bias detection, continuous monitoring with outliers and data-drift detection (Figure 10).
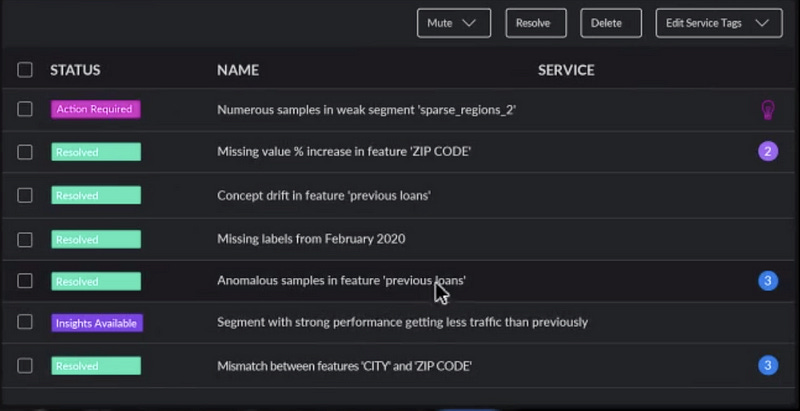
4. DeepChecks.com, A fresh startup that has risen out of stealth mode. Their website talks about supervising and controlling the health, performance, and stability of our models. Promising an end-to-end approach towards monitoring machine learning pipelines. Tracking raw-data, checking for concept-drifts, and integrity issues. A mysterious feature that promises to analyze preprocessing code for the purpose of visibility of data transformations, with additional analysis tools in order to find limitations and weak segments. In Figure 10b, we can see that a future version of their system will report alerts such as weak segments, strong segments, segments with decreased traffic and I assume increased traffic as well, missing values, concept drifts, missing labels, anomalous samples, traffic and feature mismatch which seems like negative correlations between features.
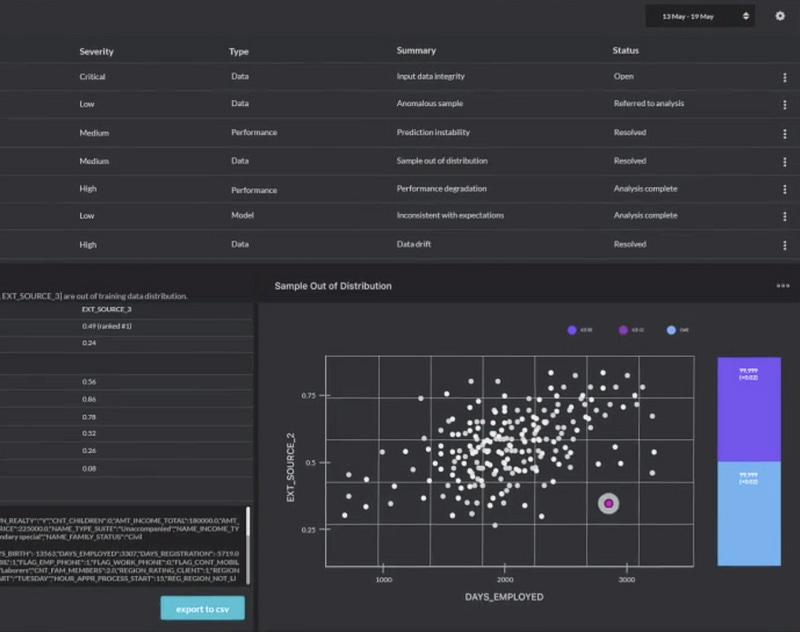
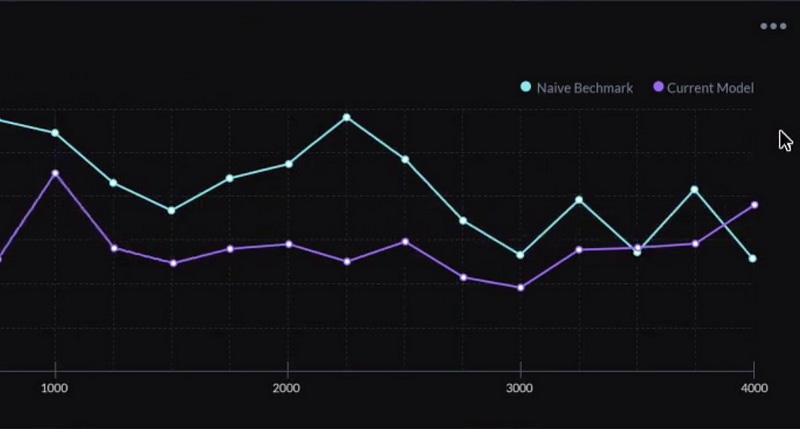
In figure 10c and 10d, we can see their alert summary and out of distribution UI, and a comparison between a baseline benchmark against the actual model’s performance, I suspect it’s based on the user’s training set or a simple model that uses an “auto-ml” methodology on their raw-data, not entirely clear if its a known metric such as F1 or otherwise.
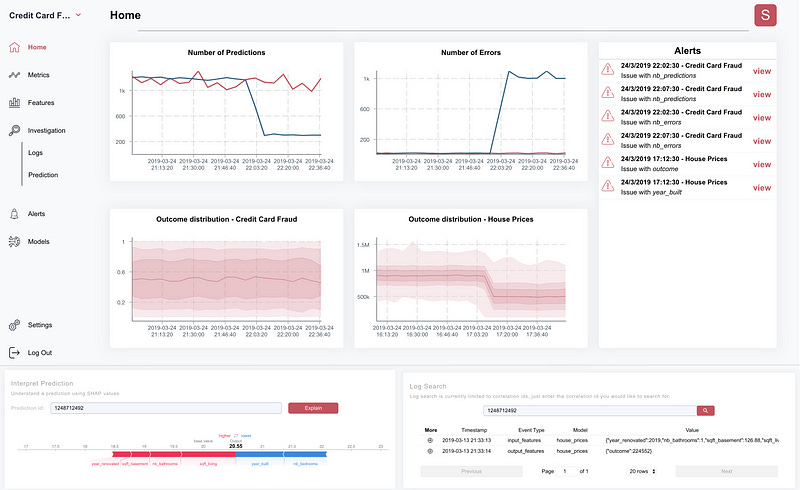
5. Stakion.io — A new startup, promising fast out-of-the-box integration, continuous real-time monitoring, automated alerts, model interpretability, and log auditing capabilities (Figure 11).
5. Arthur.ai — Another young startup, they focus on performance. explainability, bias.
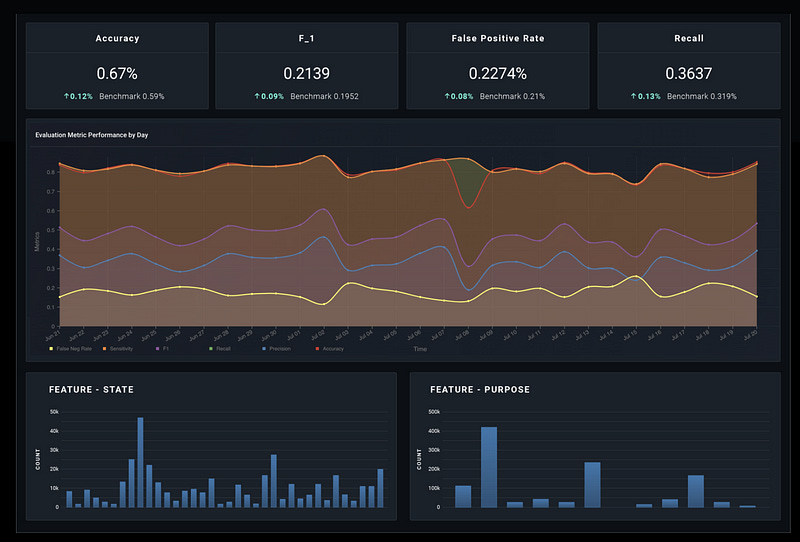
6. Arize — a company created from MonitorML & FairAI — Offers models and data distribution checks, concept drifts, feature segmentation analysis, prediction quality & explainability (Figure 12).
7. SodaData.io — Soda’s platform is quite unique in this landscape as its the only startup that targets use-cases that relate to ‘data integrity’. They help data-engineers monitor operational aspects, such as the size of new data partitions and the expected arrival time of new data. They help data-owners monitor business aspects by ensuring SLAs on mandatory fields. They help analytics teams monitor usage requirements, i.e., they ensure that categorical values remain the same and that the data distribution doesn't change over time.
8. Seldon.io Deploy — “Seldon Deploy provides oversight and governance for machine learning deployments”, please see on youtube. They provide multi-arm-bandit, outlier detection, explainability, bias & concept drift detection. They are using Alibi Explain, which is a model inspection & interpretation library for high-quality implementations of black-box, white-box, local & global explanation methods for classification and regression models.
9. Snorkel.ai — Are capitalizing on the popular Snorkel library by allowing anyone to programmatically label, build, and augment training data for end-to-end model development and deployment process, with analysis and basic monitoring capabilities.
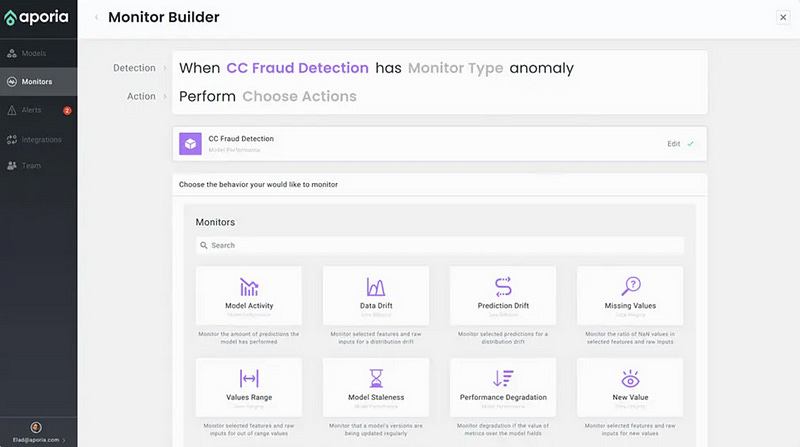
10. Aporia.com — Allows a data scientist to quickly configure advanced production monitors. Their focus on a strong UX and ease of use, as seen in Figure 12b, shows how fast you can get moving with various use-cases such as detecting drifts, monitoring data integrity issues, performance, etc.
Deployment-Oriented Platforms
These are companies that provide monitoring as an add-on, all of them have some basic monitoring. They are mostly focused on model development, deployment & serving. It also seems that you can only use the monitoring features for models that are deployed only using their service.
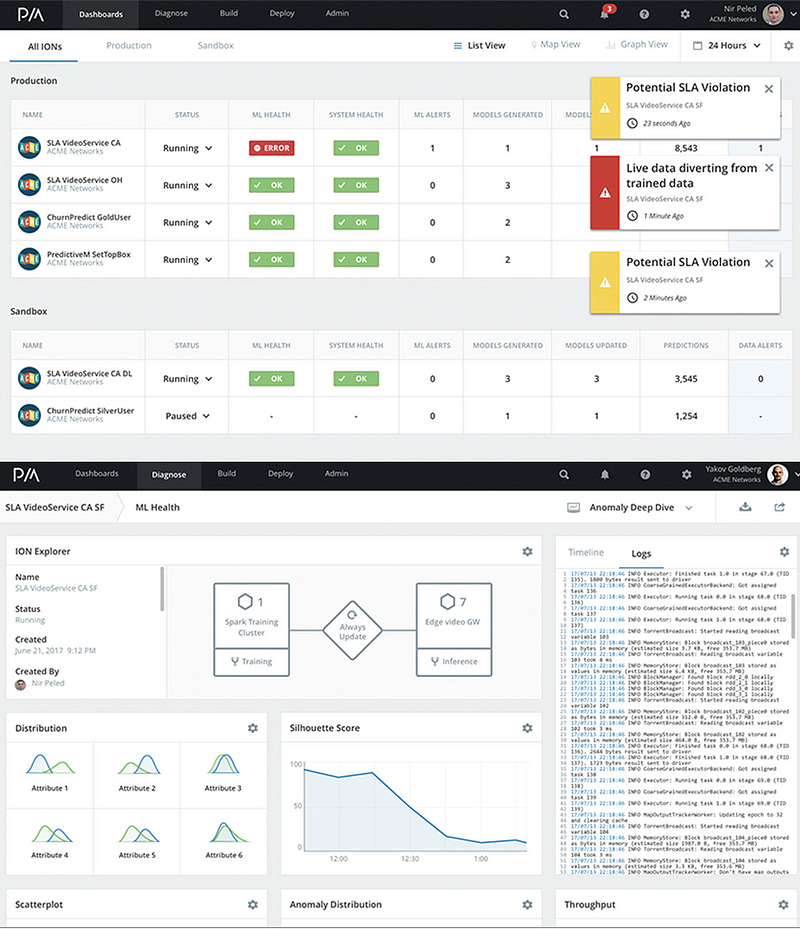
ParallelML — acquired recently by DataRobot is focused on deployment and production scaling. It integrates with Jupyter, Python to Docker, Spark, Git, Bitbucket and Cron. Offers data-drift-detection, automatic model training and prediction, promises a lightweight footprint and scalability with 150 monitored attributes and log auditing capabilities (Figure 13). It's important to note that you shouldn't use all your new data when retraining, you should practice caution when adding data you cant trust. Therefore, I suggest that ParallelIM should describe their retrain policy (or rules?) for the automatic model training.
Hydrosphere.io — “An open-source platform for Data Science and Machine Learning Management automation. Promises reliability, scalability and observability for ML and AI applications in production.”. Hydrosphere has basic observability features such as statistical checks, anomaly detection, etc.
MLFlow — ”MLflow is an open-source platform to manage the ML lifecycle, including experimentation, reproducibility and deployment. It currently offers three components: 1. MLflow Tracking — experiments with records and queries such as code, data, config, and results. 2. MLflow Projects — a packaging format for reproducible runs on any platform, and 3. MLflow Models — a general format for sending models to diverse deployment tools.
IBM Watson Open Scale — ”Is a tool that tracks and measures outcomes from AI across its lifecycle, and adapts and governs AI to changing business situations — for models built and running anywhere.”
Seldon.io — “Is an open-source Kubernetes-oriented machine learning deployment Manage, serve and scale models built in any framework.”
When the need for monitoring becomes apparent, you should make a list of the features that are or will be important to you and find the solution that ticks most of the boxes. Always engage in conversations with your solution provider, I strongly recommend talking to a tech-oriented person, especially if they are part of a startup, because your personal use-case may be slightly different than the intended solution that they provide and it may be important for them to support it.
I truly hope that this post plays an important role when you need to adapt and implement a data-science-centric monitoring service. If you have additional Ideas and Information, please feel free to comment below.
I would like to thank my fellow colleagues, Alon Nisser, Shay Yehezkel, Amit Einav, Simon Sommer-Yakov, Natanel Davidovits, Sefi Keller, Samuel Jefroykin and others, you know who you are, for reviewing this post.
Dr. Ori Cohen has a Ph.D. in Computer Science with a focus on machine learning. He is a Senior Director of Data and the author of the ML & DL Compendium and StateOfMLOps.com.